Home Tags NDVI

Tag: NDVI

Technology Advances Farming and Winemaking Practices at Rombauer

1
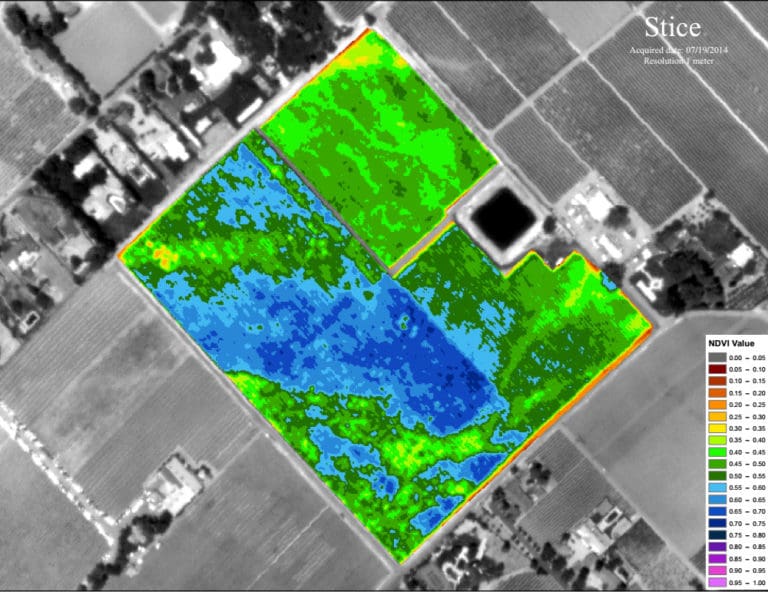
If you’ve never seen a NDVI (Normalized Difference Vegetation Index) map, they look pretty much like a topography map, which shows a green color in areas denoting healthy vegetation and yellow to red colors in more difficult areas. For the science-oriented, according to the GISgeography website, NDVI quantifies vegetation by measuring the difference between near-infrared (vegetation that strongly reflects) and red light (vegetation that absorbs). Healthy vegetation (chlorophyll) reflects more near-infrared (NIR) and green light compared to other wavelengths. But it absorbs more red and blue light, which is why our eyes see vegetation as the color green.

Proper Use of Aerial Diagnostic Maps to Improve Vineyard Performance

0
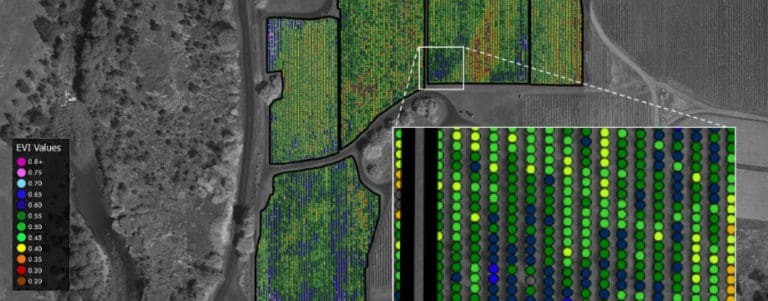
You’ve probably heard of NDVI (Normalized Difference Vegetation Index) or EVI (Enhanced Vegetation Index) maps, which are helpful in understanding the relative health of grapevines. Typically generated from multispectral imagery gathered by satellites, airplanes or drones, these maps are based on the principle that healthy plants reflect less red visible light than unhealthy plants because healthy plants absorb more of it as they are engaged in higher rates of photosynthesis.
Skip to content