Unless otherwise noted, data and insights below are for July 4th weeks in 2021 (2 weeks ending July 10, 2021) compared to July 4th weeks in 2020 and 2019 (2 weeks ending July 11, 2020 and 2 weeks ending July 6, 2019) in NielsenIQ off-premise channels.
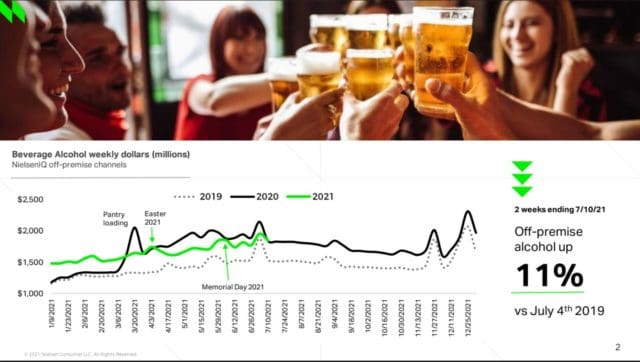
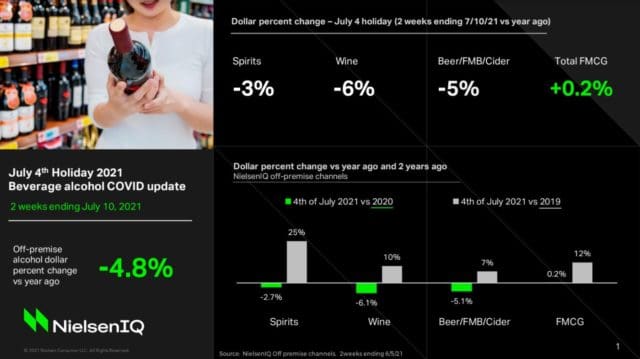
![]() The total fast-moving consumer goods (FMCG) market experienced relatively flat trends, up 0.2% in dollars compared to 2020. Off-premise alcohol sales declined for the 2021 July 4th holiday compared to 2020, which was expected given the shift back to on-premise establishments, along with the tough comps from last year. While off-premise alcohol sales declined by 4.8% compared to July 4th 2020, sales remain above the norm for off-premise, with dollar sales up 11% compared to July 4th 2019.
The total fast-moving consumer goods (FMCG) market experienced relatively flat trends, up 0.2% in dollars compared to 2020. Off-premise alcohol sales declined for the 2021 July 4th holiday compared to 2020, which was expected given the shift back to on-premise establishments, along with the tough comps from last year. While off-premise alcohol sales declined by 4.8% compared to July 4th 2020, sales remain above the norm for off-premise, with dollar sales up 11% compared to July 4th 2019.
Spirits experienced the least declines, down 2.7% compared to last year, but up 25% compared to two years ago. Beer/FMB/cider was down 5.1% (up 7% vs 2019). However, core beer (excluding FMBs and seltzer) experienced the strongest declines in beverage alcohol, down 7% (-2.9% vs 2019). Wine declined by 6.1% compared to last 4th of July, but is up 10% in off-premise channels compared to the 2019 July 4th holiday.
Ready To Drink
Ready-to-drink alcohol segments won the July 4th holiday. Spirit RTDs led growth, up 67% compared to the 2020 holiday (+428% vs 2019) and wine cocktails were up 40% (201% vs 2019). Hard seltzer growth was slower, but still surpassed 2020 sales nonetheless, up 9% (+189% vs 2019). Hard tea and kombucha also increased in sales compared to last year, up 7.2% (35% vs 2019) and 17.4% (193% vs 2019) respectively.
 The top 5 spirit RTD brands (ranked by dollars) in NielsenIQ off-premise channels were High Noon, Cutwater, On The Rocks, Monaco, and Crown Royal. Combined, these 5 brands represent nearly ⅔ (65%) of tota spirit RTD dollars in NielsenIQ off-premise channels for the July 4th holiday. Price for the total segment is also up slightly (+2.6%) compared to last year, although the average price for most of the top brands is down compared to last year.
For hard seltzers, the segment has a very different mix of players compared to just a few years ago. In 2019, the top 10 hard seltzer brands (ranked by dollars) in NielsenIQ off-premise channels were:
- White Claw
- Truly
- Bon V!v
- Smirnoff
- Henry’s
- High Noon
- Golden Road Fruit Cart
- Wild Basin
- Press
- Arctic Chill
Only 4 of those 10 brands from 2019 were also part of the top 10 for the 2021 July 4th holiday. The 2021 July 4th seltzer top 10 brands were:
- White Claw
- Truly
- Bud Light
- High Noon
- Corona
- Vizzy
- Mich Ultra
- Topo Chico
- Mike’s Hard
- Smirnoff
We should also note that for year-to-date trends, Cacti holds the #10 spot, but Smirnoff took the #10 spot for the July 4th holiday.
Beer/FMB/Cider/Seltzer
For the biggest beer holiday of the year, the category had lackluster performance in the off-premise channels this year, with dollar sales down 5.1% compared to last year, and up 7% compared to 2019, which was driven in great part by beyond beer segments.
 Core beer (excludes FMBs, cider, and seltzers) declined by 2.9% compared to 2019, with premium light and below premium experiencing the greatest losses, down 9.2% and 13.9% vs 2019 respectively.. Other segments declining in off-premise channels compared to 2019 include cider (-7.9%), flavored malt beverages (-3.6%) and craft (-1.9%).
There were, however, some bright pockets of growth in the category, with seltzers experiencing the largest gains in actual dollars compared to any other segment. Seltzers reached the segment’s highest share ever in the category, accounting for nearly 13% of category dollars. The segment had $280 million in sales in NielsenIQ off-premise channels for the July 4th holiday. That’s more than sales for all red table wine sold in those same channels for the July 4th holiday.


Other segments in the category contributing to growth include Mexican imports (+6.3% vs 2020 and 9.4% vs 2019), and non-alcoholic beer (+29% vs 2020 and +70% vs 2019). Both of these segments experienced slight share gains compared to 2019, with Mexican imports up 0.4 share points and non-alcoholic up 0.2 points, now accounting for 0.6% of total beer dollars.
Spirits
Aside from ready-to-drink cocktails, the only other categories in spirits to grow compared to last year’s 4th of July holiday were tequila (+6.5% vs 2020 and +76% vs 2019), Scotch (+3% vs 2020 and 25% vs 2019) and Japanese whisky (+7.6% vs 2020and 61% vs 2019). As the largest contributor to overall dollar growth in off-premise spirits, ready-to-drink cocktails gained 2 share points compared to last year, and accounted for nearly 5% of spirit dollars for the July 4th holiday. Tequila also gained significant share, up 1.2 share points from 2020, now accounting for nearly 14% of spirits dollars in off-premise channels.
The high end of spirits continues to drive growth, with the ultra premium price tier up 12% compared to last year and +94% compared to 2019. Remember that during the pandemic, premiumization in alcohol experienced accelerated growth rates in off-premise channels. While premiumization most definitely continues in spirits, it is slowing compared to the accelerated rates from last year. For the July 4th holiday 2020, the high end of spirits (super premium and ultra price tiers) gained 4.3 share points compared to 2019. For 2021, the high end continues to gain share, but at a slower rate, now up 1.8 share points compared to last year.
Wine
For the two weeks ending 7/10/211, nearly all segments of wine are down compared to 2020; however, nearly all segments are up compared to 2019, with the total wine category up 10% compared to July 4th 2019. Segments that continue to grow, even when compared to 2020 sales, include sparkling wine (+1.4% vs 2020 and +29% vs 2019), French champagne (+6.9% vs 2020 and +71% vs 2019), wine-based cocktails (+40% vs 2020 and +201% vs 2019), and non-alcoholic wine (+38% vs 202 and +77% vs 2019).
Compared to 2019, growth rates of domestic table wine (+3.7% vs 2019) continue to outpace growth of imported table wine (+2.6%). Domestic table wine growth is led by wines from Oregon, which have grown 19% in dollars over the past two years. California wines were also contributors to growth, up 4.2% in off-premise channels compared to 2019. Leaders among imported wines include New Zealand (+13.5% vs 2019) and Italian (+11.1% vs 2019).


